bis 39
40+
50+
60+
0
20
40
60
80
100
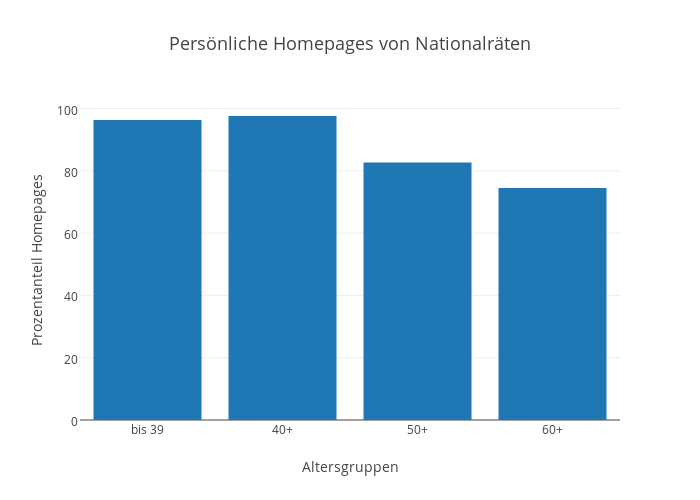
Persönliche Homepages von Nationalräten
Altersgruppen
Prozentanteil Homepages
plotly-logomark
Edit chart
Egloff.mario's interactive graph and data of "Persönliche Homepages von Nationalräten" is a bar chart, showing Col2; with Altersgruppen in the x-axis and Prozentanteil Homepages in the y-axis.. The x-axis shows values from -0.5 to 3.5. The y-axis shows values from 0 to 102.73684210526315.