2010-2011
2011-2012
2012-2013
2013-2014
1600
1650
1700
1750
1800
1850
1900
1950
# of visitors
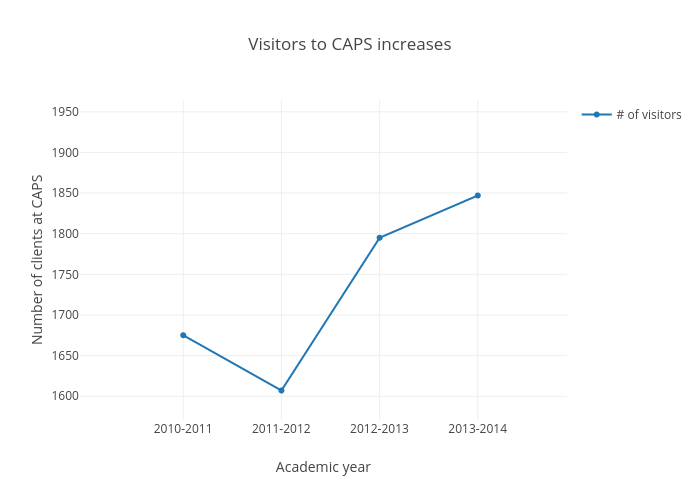
Visitors to CAPS increases
Academic year
Number of clients at CAPS
plotly-logomark
Edit chart
Dukechronicle's interactive graph and data of "Visitors to CAPS increases" is a scatter chart, showing # of visitors; with Academic year in the x-axis and Number of clients at CAPS in the y-axis.. The x-axis shows values from -1.0515397331283975 to 3.9084703955819635. The y-axis shows values from 1570.6936882665061 to 1964.5552333018768.