5.867
5.868
5.869
5.87
5.871
5.872
5.873
5.874
5.875
−4
−2
0
2
4
6
8
10
12
14
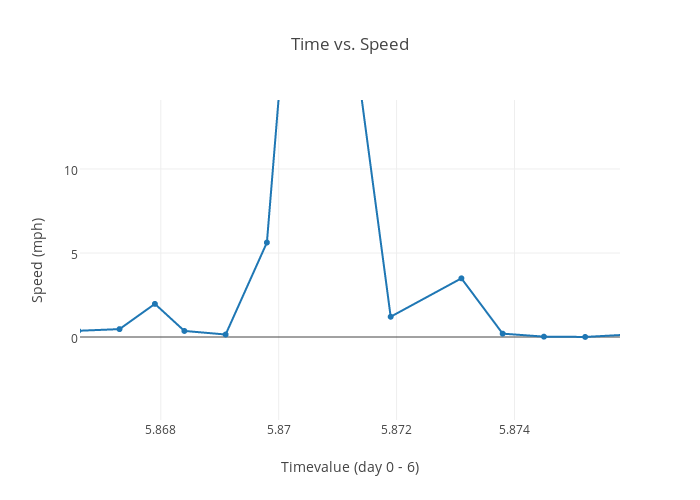
Time vs. Speed
Timevalue (day 0 - 6)
Speed (mph)
plotly-logomark
Edit chart
Dmrussell's interactive graph and data of "Time vs. Speed" is a line chart, showing Speed (mph); with Timevalue (day 0 - 6) in the x-axis and Speed (mph) in the y-axis.. The x-axis shows values from 5.8666293862450924 to 5.8757904958720815. The y-axis shows values from -4.939599444682803 to 14.106232799052568.