QR scanning time vs fps & size
plotly-logomark
Edit chart
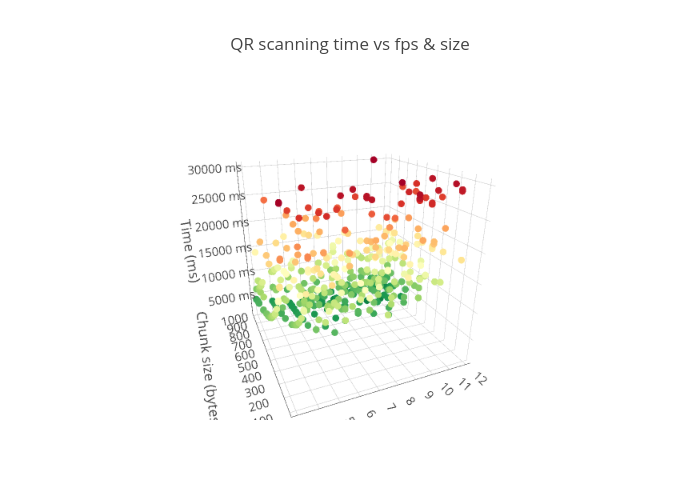
Divan0's interactive graph and data of "QR scanning time vs fps & size" is a scatter3d. The x-axis shows values from 3 to 12. The y-axis shows values from 0 to 32093.266964648516.