Jan 2017
Mar 2017
May 2017
Jul 2017
Sep 2017
Nov 2017
Jan 2018
Mar 2018
May 2018
Jul 2018
400
450
500
550
600
650
700
750
800
用電總度數
移動平均(15)
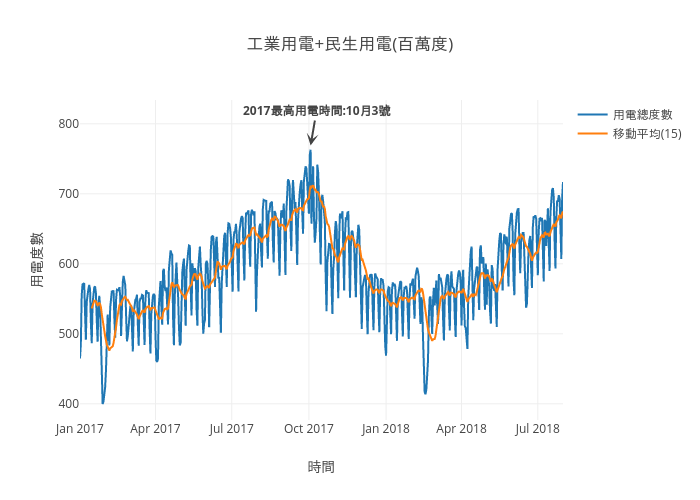
工業用電+民生用電(百萬度)
時間
用電度數
2017最高用電時間:10月3號
plotly-logomark
Edit chart
Diaper151's interactive graph and data of "工業用電+民生用電(百萬度)" is a line chart, showing 用電總度數 vs 移動平均(15); with 時間 in the x-axis and 用電度數 in the y-axis.. The x-axis shows values from 2017-01-01 to 2018-07-31. The y-axis shows values from 375.5114586216441 to 859.9622861887628. This visualization has the following annotation: 2017最高用電時間:10月3號