East1
East2
East3
East4
East5
East6
East7
East8
West1
West2
West3
West4
West5
West6
West7
West8
0
0.2
0.4
0.6
0.8
1
$160 mil
$120 mil
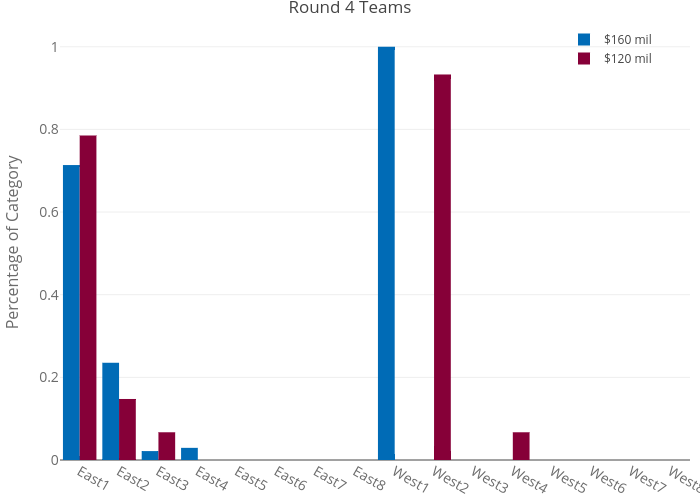
Round 4 Teams
Percentage of Category
plotly-logomark
Edit chart
Dancsalo's interactive graph and data of "Round 4 Teams" is a grouped bar chart, showing $160 mil vs $120 mil; with Percentage of Category in the y-axis. The x-axis shows values from 0 to 0. The y-axis shows values from 0 to 0.