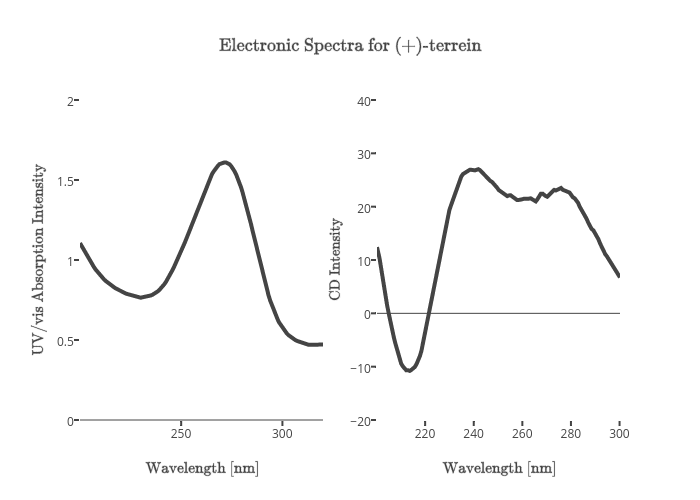
$\text{Electronic Spectra for (+)-terrein}$
plotly-logomark
Edit chart
Loading graph
Cstein's interactive graph and data of "$\text{Electronic Spectra for (+)-terrein}$" is a line chart, showing B vs D; with $\text{Wavelength [nm]}$ in the x-axis and $\text{UV/vis Absorption Intensity}$ in the y-axis.. The x-axis shows values from 200.028 to 320.04294. The y-axis shows values from 0 to 2.