770
780
790
800
810
820
830
840
0
0.2
0.4
0.6
0.8
1
4 K
77 K
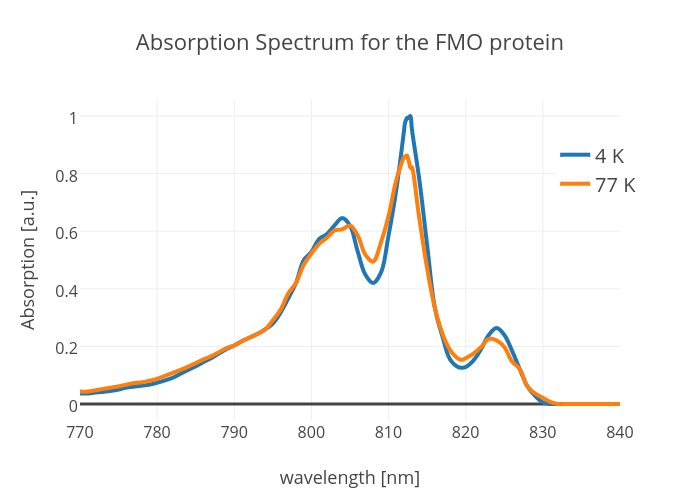
Absorption Spectrum for the FMO protein
wavelength [nm]
Absorption [a.u.]
plotly-logomark
Edit chart
Cstein's interactive graph and data of "Absorption Spectrum for the FMO protein" is a scatter chart, showing 4 K vs 77 K; with wavelength [nm] in the x-axis and Absorption [a.u.] in the y-axis.. The x-axis shows values from 770 to 840. The y-axis shows values from -0.05555555555555555 to 1.0555555555555556.