0%
10%
20%
30%
40%
50%
60%
70%
White
Black
Hispanic
plotly-logomark
Edit chart
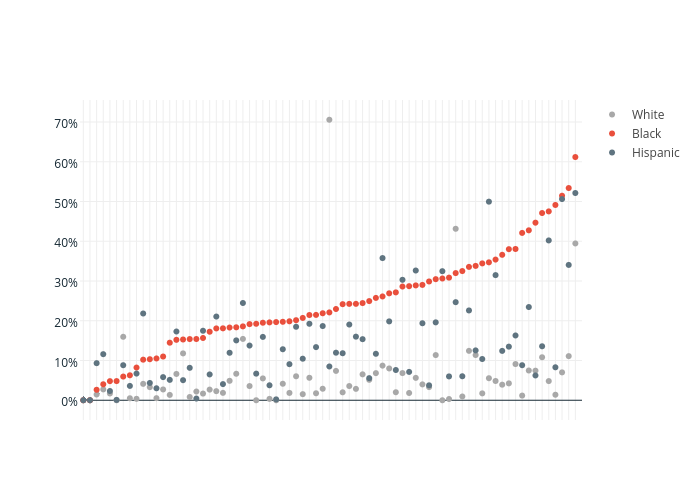
Cliomiso's interactive graph and data of "White, Black , Hispanic " is a scatter chart, showing White, Black , Hispanic . The x-axis shows values from -0.5 to 75. The y-axis shows values from -4.512486375886203 to 75.0778245058862.