0%
5%
10%
15%
20%
25%
30%
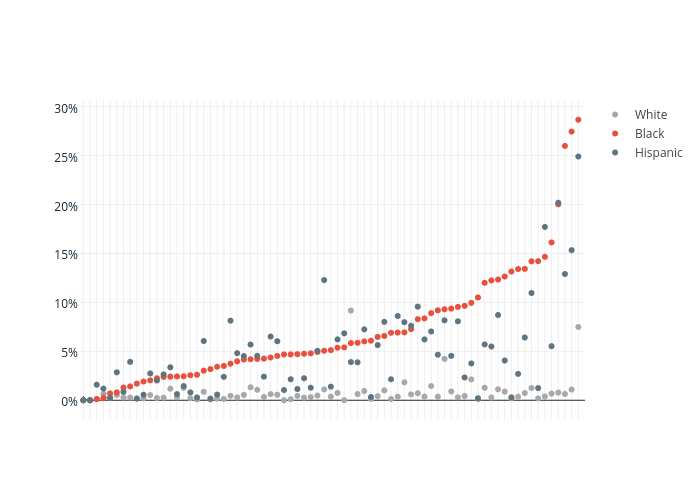
White
Black
Hispanic
plotly-logomark
Edit chart
Cliomiso's interactive graph and data of "White, Black, Hispanic" is a scatter chart, showing White, Black, Hispanic. The x-axis shows values from -0.5 to 75. The y-axis shows values from -1.8328923594964754 to 30.495287839496477.