0
200
400
600
800
1000
1200
1400
200
250
300
350
400
450
500
550
plotly-logomark
Edit chart
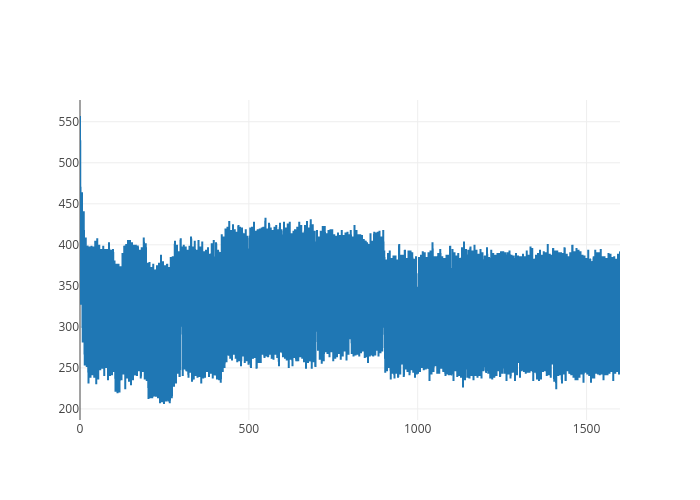
Plotly is a collaborative data analysis and graphing tool. The x-axis shows values from 0 to 0. The y-axis shows values from 0 to 0.