0e+00
2e+05
4e+05
0
1
2
3
1550
Merlin
Magnification
log10(pixel size/nm)
instrument
plotly-logomark
Edit chart
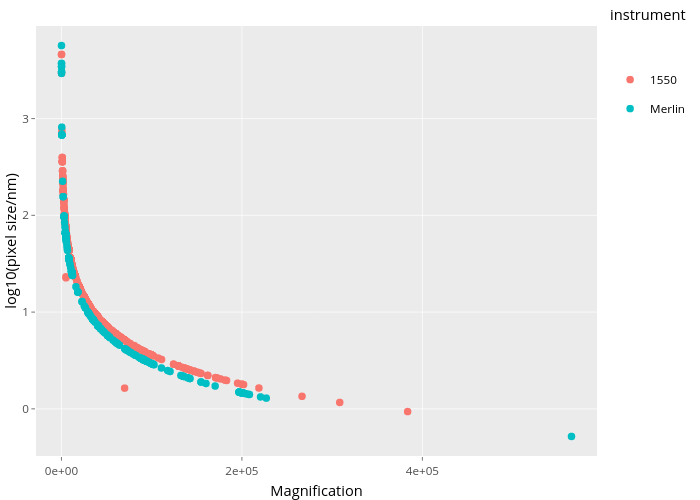
Chepec's interactive graph and data of "log10(pixel size/nm) vs Magnification" is a scatter chart, showing 1550 vs Merlin; with Magnification in the x-axis and log10(pixel size/nm) in the y-axis.. The x-axis shows values from -28208.4 to 593520.4. The y-axis shows values from -0.487257962651296 to 3.95688995162852. This visualization has the following annotation: instrument