0
100
200
300
400
500
600
500
600
700
800
900
1000
1100
1200
plotly-logomark
Edit chart
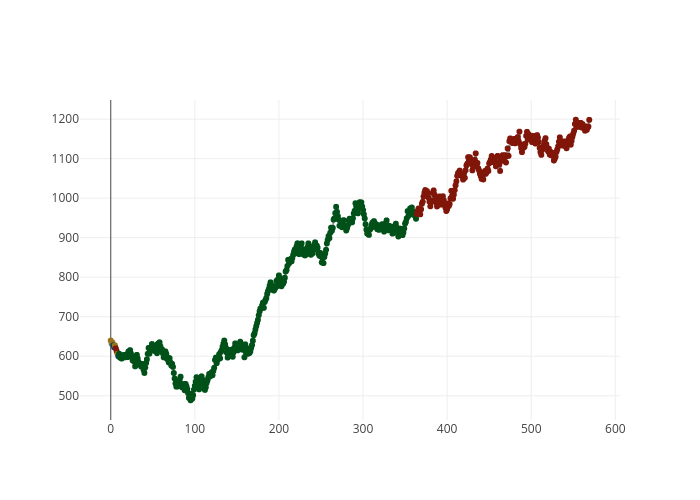
Bsse's interactive graph and data is a line chart. The x-axis shows values from 0 to 0. The y-axis shows values from 0 to 0.