Ebit (ber.)
0
100
200
300
400
500
600
700
800
Q2/14
Q2/15 Konsens
Q2/15 Ist
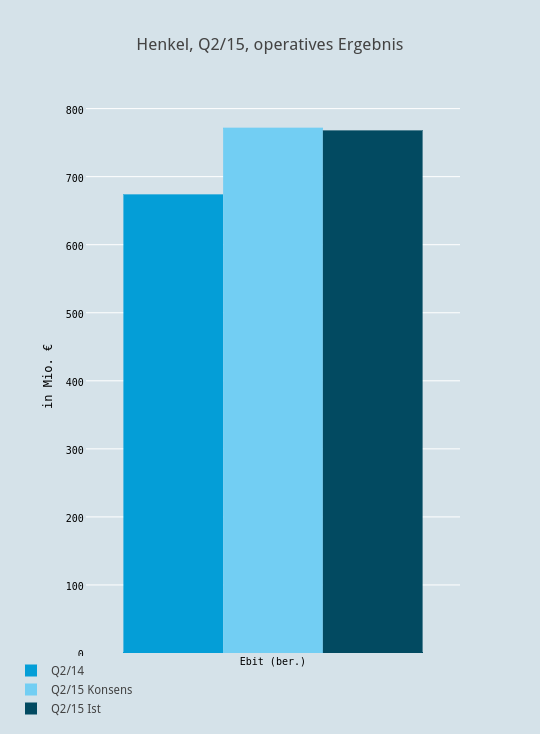
Henkel, Q2/15, operatives Ergebnis
in Mio. €
plotly-logomark
Edit chart
Boerse's interactive graph and data of "Henkel, Q2/15, operatives Ergebnis" is a bar chart, showing Q2/14, Q2/15 Konsens, Q2/15 Ist; with in Mio. € in the y-axis. The x-axis shows values from 0.5 to 1.5. The y-axis shows values from 0 to 812.6315789473684.