1998
2000
2002
2004
2006
2008
2010
2012
2014
0
200
400
600
800
1000
1200
Number Pedestrians Injured
Goods
Bus or coach
Pedal cycle
Car
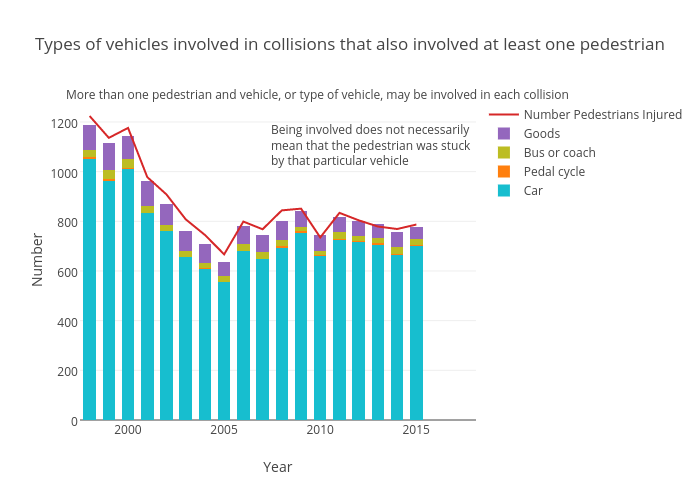
Types of vehicles involved in collisions that also involved at least one pedestrian
Year
Number
More than one pedestrian and vehicle, or type of vehicle, may be involved in each collision
Being involved does not necessarily
mean that the pedestrian was stuck
by that particular vehicle
plotly-logomark
Edit chart
Bobharper's interactive graph and data of "Types of vehicles involved in collisions that also involved at least one pedestrian" is a stacked bar chart, showing Car, Pedal cycle, Bus or coach, Goods, Number Pedestrians Injured; with Year in the x-axis and Number in the y-axis.. The x-axis shows values from 1997.5 to 2015.5. The y-axis shows values from 0 to 1288.421052631579. This visualization has the following annotations: More than one pedestrian and vehicle, or type of vehicle, may be involved in each collision; Being involved does not necessarily mean that the pedestrian was stuck by that particular vehicle