-10.0`
-9.5`
-9.2`
-9.0`
-8.0`
-7.5`
-7.2`
-7.0`
-6.5`
-5.8`
-5.6`
-5.0`
-4.4`
-4.0`
-2.0`
-0.4`
-0.3`
-0.1`
0.0`
0.4`
1.0`
1.9`
2.5`
2.8`
3.0`
3.2`
3.4`
3.5`
3.8`
4.0`
4.5`
5.0`
5.2`
6.0`
6.4`
7.0`
7.4`
8.0`
8.3`
8.5`
9.0`
10.0`
0
0.5
1
1.5
2
2.5
3
3.5
4
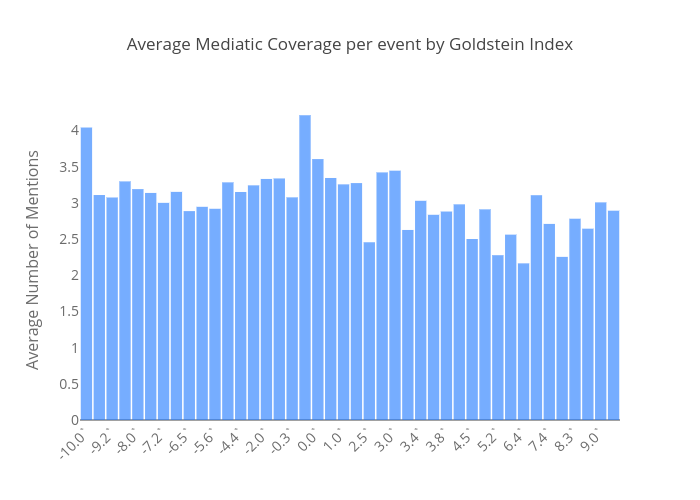
Average Mediatic Coverage per event by Goldstein Index
Average Number of Mentions
plotly-logomark
Edit chart
Bizeul1's interactive graph and data of "Average Mediatic Coverage per event by Goldstein Index" is a bar chart, showing Average Media Coverage; with Average Number of Mentions in the y-axis. The x-axis shows values from -0.5 to 41.5. The y-axis shows values from 0 to 4.420074887250555.