USA
Australia
Pakistan
Syria
0
5M
10M
15M
20M
25M
30M
35M
Violent events
Peaceful events
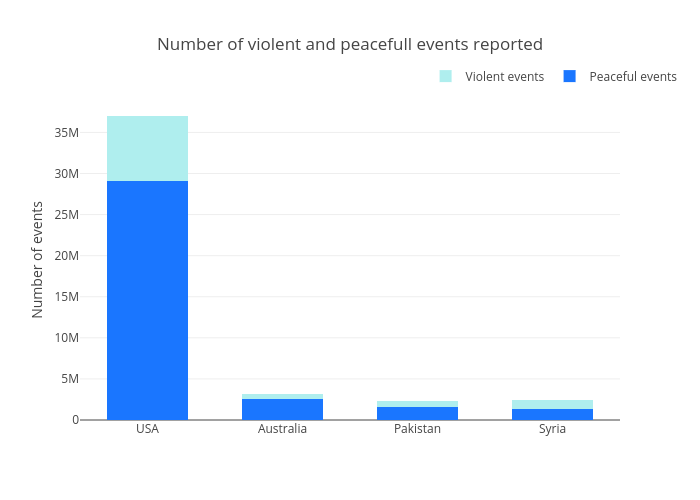
Number of violent and peacefull events reported
Number of events
plotly-logomark
Edit chart
Bizeul1's interactive graph and data of "Number of violent and peacefull events reported" is a stacked bar chart, showing Peaceful events vs Violent events; with Number of events in the y-axis. The x-axis shows values from -0.5 to 3.5. The y-axis shows values from 0 to 38945443.15789474.