AKV
AUL
BCV
BLT
BWV
HHI
OKW
OKWe
PVB
SSR
VGC
VGF
VWL
60
80
100
120
140
Accepted
Taken
2016 ROFR Summary (through June 2016)
Resort
Price Per Point ($)
plotly-logomark
Edit chart
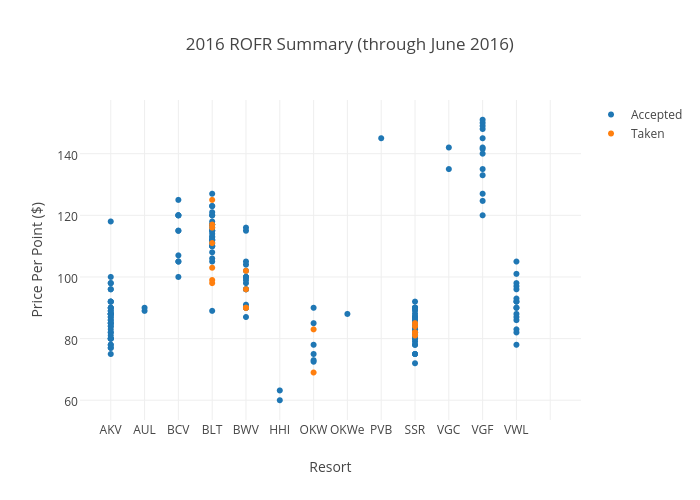
Bfrantz04's interactive graph and data of "2016 ROFR Summary (through June 2016)" is a scatter chart, showing Accepted vs Taken; with Resort in the x-axis and Price Per Point ($) in the y-axis.. The x-axis shows values from -0.7538210243845527 to 13.753821024384553. The y-axis shows values from 54.529237844940866 to 156.47076215505913.