AKV
AUL
BCV
BLT
BWV
HHI
OKW
OKWe
PVB
SSR
VB
VGC
VGF
VWL
HH
40
60
80
100
120
140
Accepted
Taken
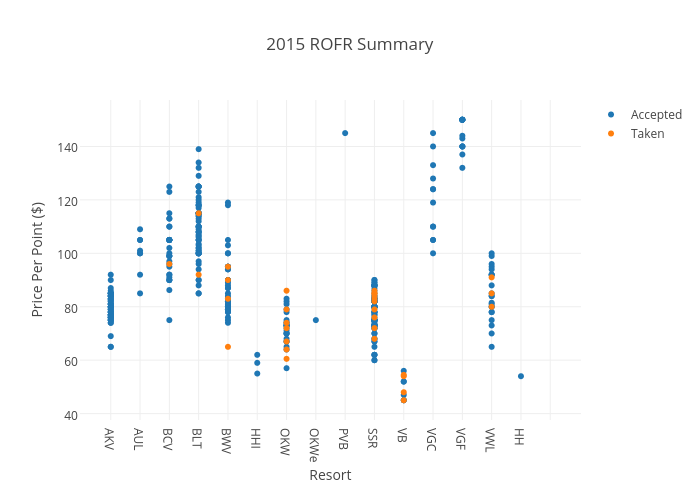
2015 ROFR Summary
Resort
Price Per Point ($)
plotly-logomark
Edit chart
Bfrantz04's interactive graph and data of "2015 ROFR Summary" is a scatter chart, showing Accepted vs Taken; with Resort in the x-axis and Price Per Point ($) in the y-axis.. The x-axis shows values from -0.8697934896744838 to 15.869793489674484. The y-axis shows values from 38.687582128777926 to 156.31241787122207.