AKV
BCV
BLT
BWV
HHI
OKW
SSR
VB
VGC
VWL
30
40
50
60
70
80
90
100
Accepted
Taken
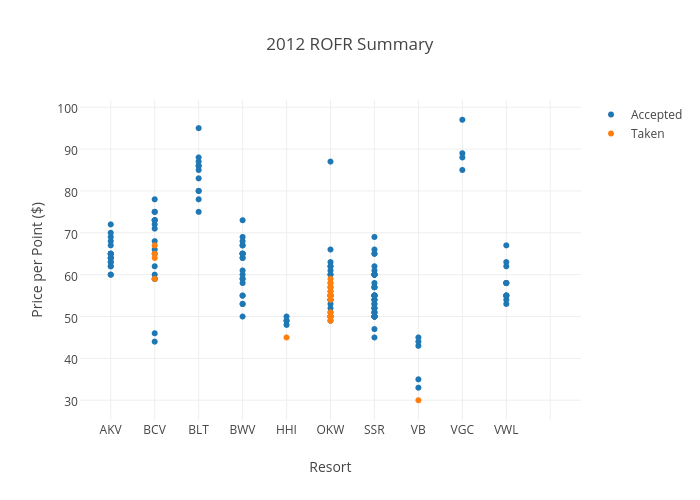
2012 ROFR Summary
Resort
Price per Point ($)
plotly-logomark
Edit chart
Bfrantz04's interactive graph and data of "2012 ROFR Summary" is a scatter chart, showing Accepted vs Taken; with Resort in the x-axis and Price per Point ($) in the y-axis.. The x-axis shows values from -0.579862326449656 to 10.579862326449655. The y-axis shows values from 25.972076215505915 to 101.02792378449409.