0
0.05
0.1
0.15
0.2
0.25
0.3
−0.08
−0.06
−0.04
−0.02
0
0.02
0.04
0.06
0.08
Nozzle Length (m)
Nozzle Radius (m)
Method of Characteristics
Conical
Rao Method
plotly-logomark
Edit chart
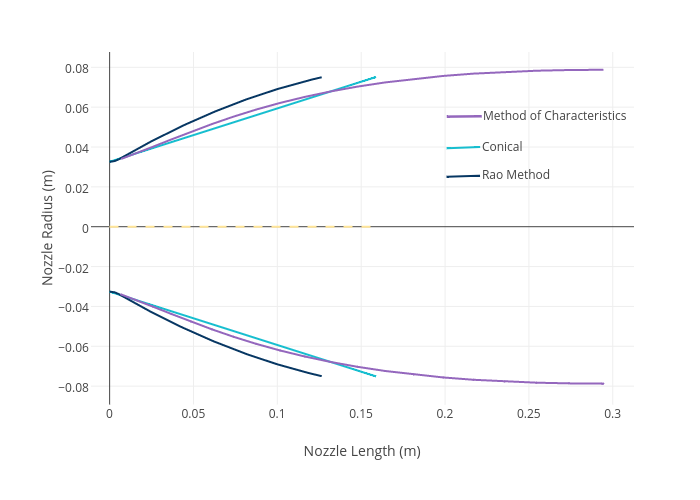
Benjmunro's interactive graph and data of "Nozzle Radius (m) vs Nozzle Length (m)" is a line chart, showing trace 0, trace 1, trace 2, trace 3, trace 4, trace 5, trace 6, trace 7, trace 8; with Nozzle Length (m) in the x-axis and Nozzle Radius (m) in the y-axis.. The x-axis shows values from -0.01018952827892926 to 0.31143852827892926. The y-axis shows values from -0.08939191209142891 to 0.08760483747849626. This visualization has the following annotations: Method of Characteristics ; Conical ; Rao Method