5.0
5.5
6.0
6.5
7.0
75
80
85
90
FALSE
TRUE
Sliders and Tommy John
Release Extension
Effective Speed
Tommy John?
plotly-logomark
Edit chart
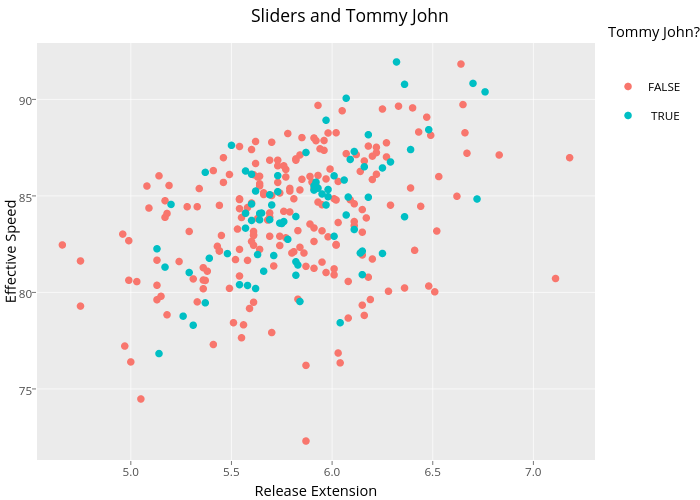
Benfb's interactive graph and data of "Sliders and Tommy John" is a scatter chart, showing FALSE vs TRUE; with Release Extension in the x-axis and Effective Speed in the y-axis.. The x-axis shows values from 4.534 to 7.306. The y-axis shows values from 71.318 to 92.922. This visualization has the following annotation: Tommy John?