0
200
400
600
800
1000
0
0.5
1
1.5
2
2.5
Classic
Karatsuba
N
Time
plotly-logomark
Edit chart
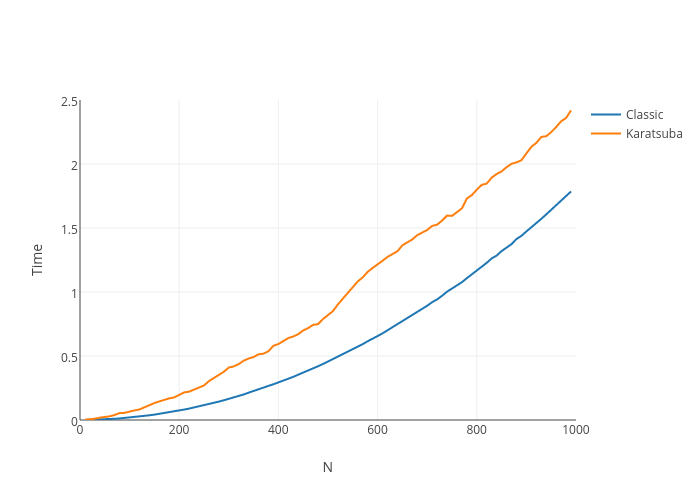
Beetle_b's interactive graph and data of "Time vs N" is a line chart, showing Classic vs Karatsuba; with N in the x-axis and Time in the y-axis.. The x-axis shows values from 0 to 1000. The y-axis shows values from 0 to 2.5.