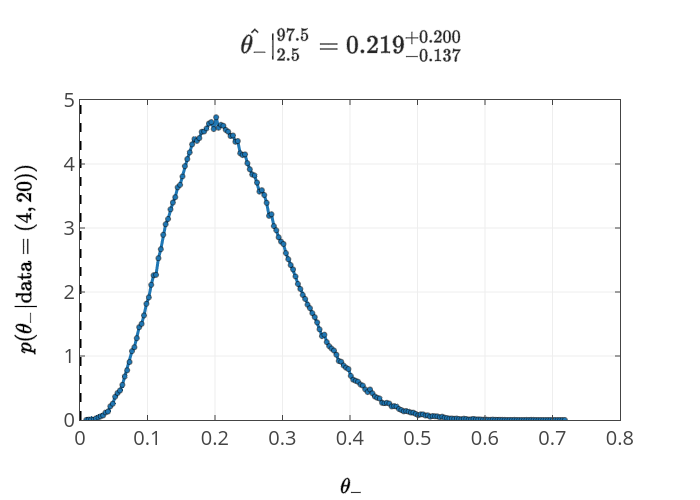
$\hat{\theta_-}|^{97.5}_{2.5}=0.219^{+0.200}_{-0.137}$
plotly-logomark
Edit chart
Loading graph
Bblais's interactive graph and data of "$\hat{\theta_-}|^{97.5}_{2.5}=0.219^{+0.200}_{-0.137}$" is a line chart, showing _line0 vs _line1. The x-axis shows values from 0 to 0. The y-axis shows values from 0 to 0.