Jan
Feb
Mar
Apr
May
Jun
Jul
Aug
Sep
Oct
Nov
Dec
2010
2011
2012
2013
2014
2015
2016
0
200
400
600
800
1000
1200
1400
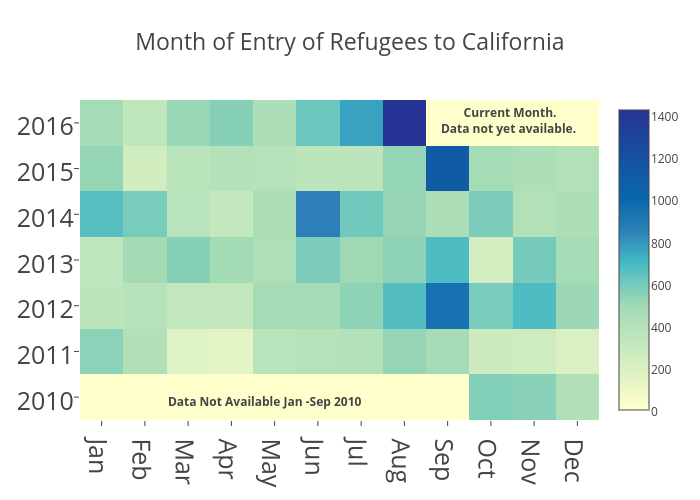
Month of Entry of Refugees to California
Data Not Available Jan -Sep 2010
Current Month.
Data not yet available.
plotly-logomark
Edit chart
Ayatamin's interactive graph and data of "Month of Entry of Refugees to California" is a heatmap. The x-axis shows values from -0.5 to 11.5. The y-axis shows values from 2009.5 to 2016.5. This visualization has the following annotations: Data Not Available Jan -Sep 2010; Current Month.Data not yet available.