0
50
100
150
200
250
300
350
0
20
40
60
80
100
120
140
160
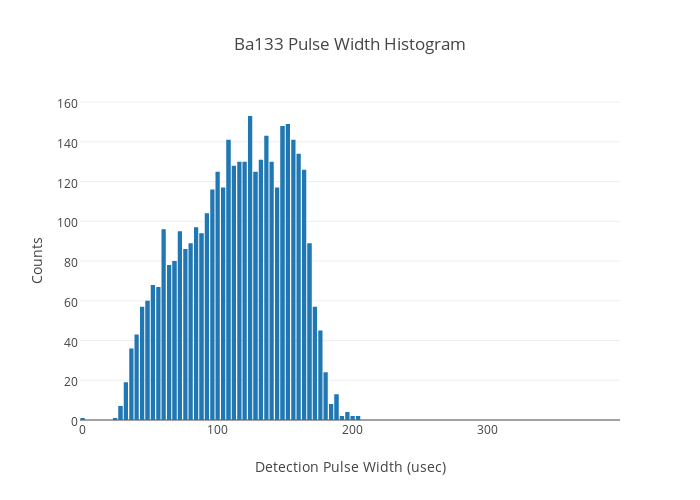
Ba133 Pulse Width Histogram
Detection Pulse Width (usec)
Counts
plotly-logomark
Edit chart
Arducordermini's interactive graph and data of "Ba133 Pulse Width Histogram" is a bar chart, showing y; with Detection Pulse Width (usec) in the x-axis and Counts in the y-axis.. The x-axis shows values from -2 to 398. The y-axis shows values from 0 to 161.05263157894737.