0
50
100
150
200
250
300
350
0
100
200
300
400
500
Counts
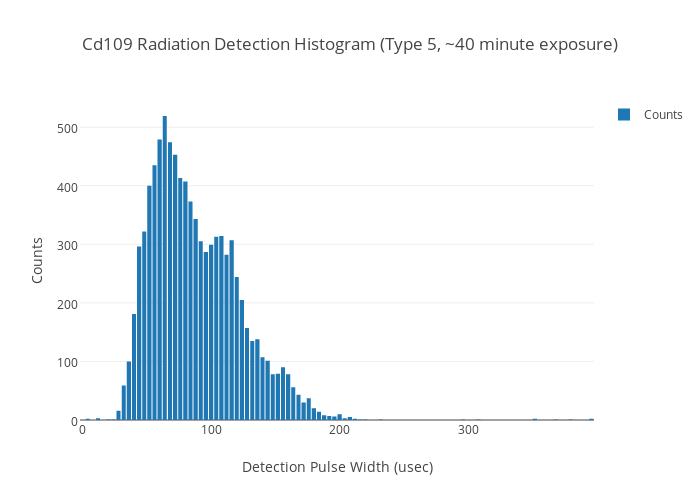
Cd109 Radiation Detection Histogram (Type 5, ~40 minute exposure)
Detection Pulse Width (usec)
Counts
plotly-logomark
Edit chart
Arducordermini's interactive graph and data of "Cd109 Radiation Detection Histogram (Type 5, ~40 minute exposure)" is a bar chart, showing Counts; with Detection Pulse Width (usec) in the x-axis and Counts in the y-axis.. The x-axis shows values from -2 to 398. The y-axis shows values from 0 to 546.3157894736842.