Even
Odd
Every
0
2k
4k
6k
8k
10k
12k
One week of the month
Every other week, or two specific weeks of the month
Weekly
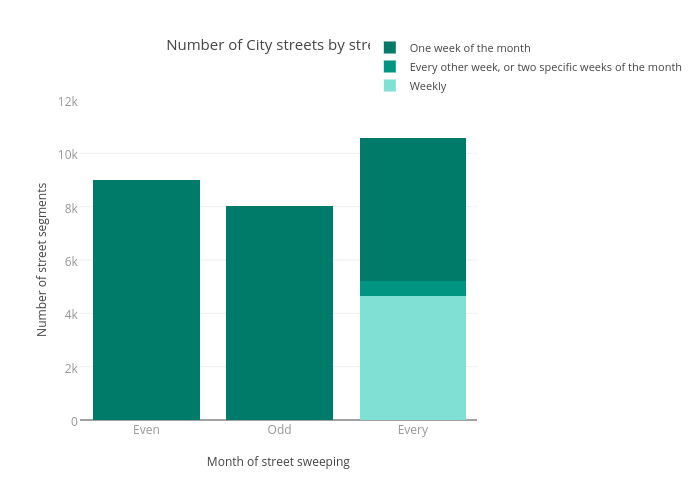
Number of City streets by street sweeping frequency
Month of street sweeping
Number of street segments
plotly-logomark
Edit chart
Andrell81's interactive graph and data of "Number of City streets by street sweeping frequency" is a stacked bar chart, showing Weekly, Every other week, or two specific weeks of the month, One week of the month; with Month of street sweeping in the x-axis and Number of street segments in the y-axis.. The x-axis shows values from -0.5 to 2.480879906693945. The y-axis shows values from 0 to 12000.