0
0.2
0.4
0.6
0.8
1
0
0.2
0.4
0.6
0.8
1
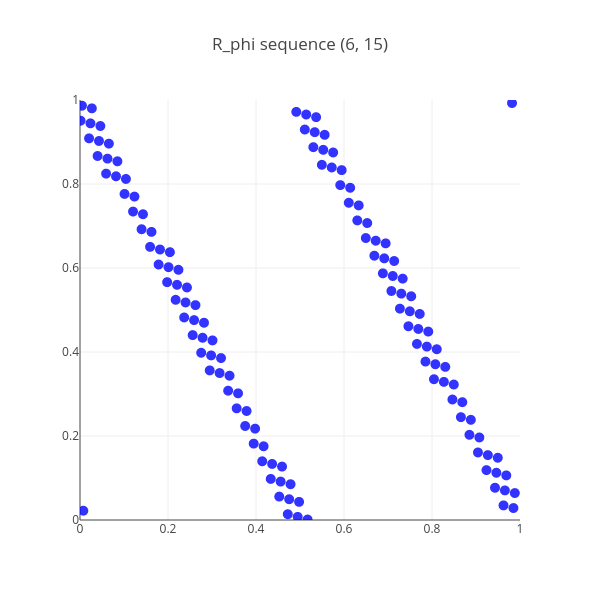
R_phi sequence (6, 15)
plotly-logomark
Edit chart
Anderslanglands's interactive graph and data of "R_phi sequence (6, 15)" is a scatter chart. The x-axis shows values from 0 to 1. The y-axis shows values from 0 to 1.