1980
1985
1990
1995
2000
2005
2010
2015
0
2M
4M
6M
8M
10M
12M
ND (forecast)
MT (forecast)
CO (forecast)
NE (forecast)
ND
MT
CO
NE
Planted acres by state, wheat
Year
Planted acres, wheat
plotly-logomark
Edit chart
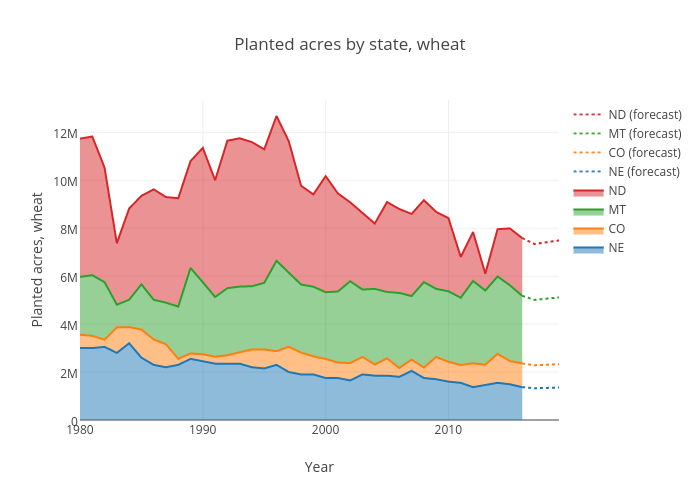
Ageconmt's interactive graph and data of "Planted acres by state, wheat" is a filled line chart, showing NE, CO, MT, ND, NE (forecast), CO (forecast), MT (forecast), ND (forecast); with Year in the x-axis and Planted acres, wheat in the y-axis.. The x-axis shows values from 1980 to 2019. The y-axis shows values from 0 to 13347368.421052631.