2008
2010
2012
2014
2016
2,000
2,200
2,400
2,600
2,800
3,000
3,200
2,000
3,000
4,000
5,000
6,000
7,000
8,000
9,000
10,000
Expenditures
NGP wheat production
US wheat production
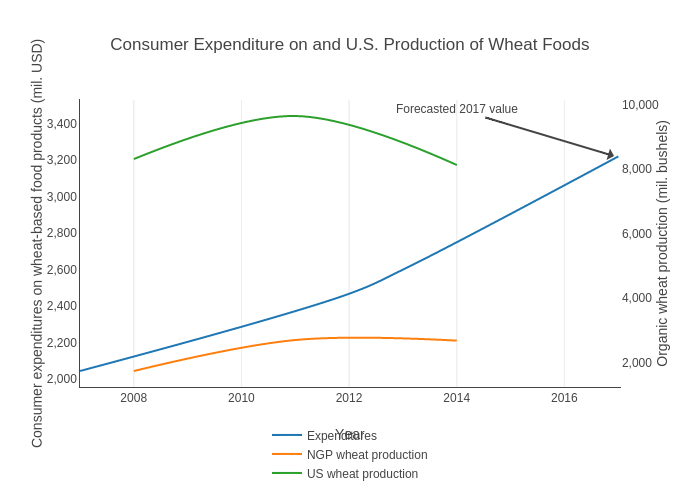
Consumer Expenditure on and U.S. Production of Wheat Foods
Year
Consumer expenditures on wheat-based food products (mil. USD)
Organic wheat production (mil. bushels)
Forecasted 2017 value
plotly-logomark
Edit chart
Ageconmt's interactive graph and data of "Consumer Expenditure on and U.S. Production of Wheat Foods" is a line chart, showing Expenditures, NGP wheat production, US wheat production; with Year in the x-axis and Consumer expenditures on wheat-based food products (mil. USD) in the y-axis.. The x-axis shows values from 2007 to 2017. The y-axis shows values from 1948.038275306507 to 3314.0973974254402. This visualization has the following annotation: Forecasted 2017 value