0
1
2
3
4
5
1e−4
2
5
1e−3
2
5
0.01
2
5
0.1
2
5
1
2
5
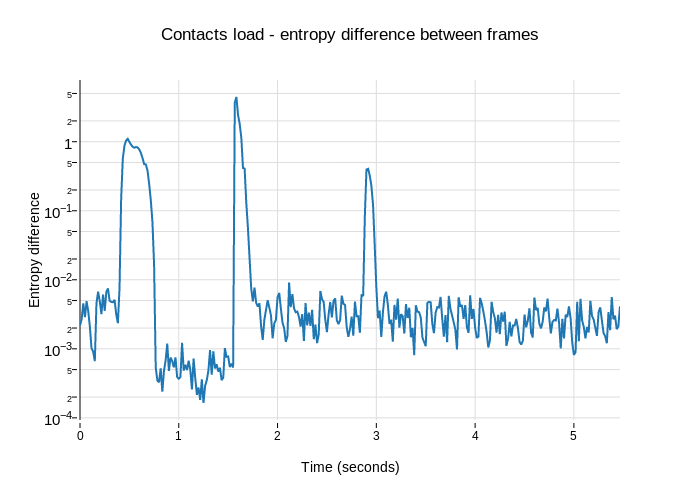
Contacts load - entropy difference between frames
Time (seconds)
Entropy difference
plotly-logomark
Edit chart
Williamlachance's interactive graph and data of "Contacts load - entropy difference between frames" is a scatter chart, showing contacts-load-entropydiffs (1).csv; with Time (seconds) in the x-axis and Entropy difference in the y-axis.. The x-axis shows values from 0 to 5.46666666667. The y-axis shows values from -4.03109648593533 to 0.8939296819885401.