0
1
2
3
4
5
2
5
1e+3
2
5
1e+4
2
5
1e+5
2
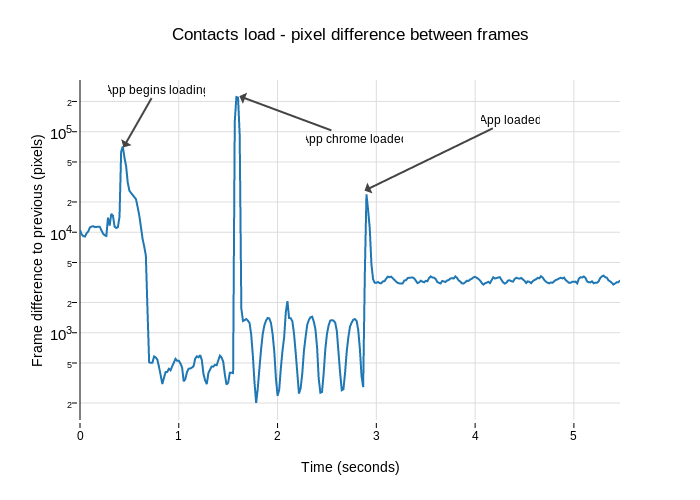
Contacts load - pixel difference between frames
Time (seconds)
Frame difference to previous (pixels)
App begins loading
App chrome loaded
App loaded
plotly-logomark
Edit chart
Williamlachance's interactive graph and data of "Contacts load - pixel difference between frames" is a scatter chart, showing contacts-load-framediffs.csv; with Time (seconds) in the x-axis and Frame difference to previous (pixels) in the y-axis.. The x-axis shows values from 0 to 5.46666666667. The y-axis shows values from 2.129090526877854 to 5.567879902600386. This visualization has the following annotations: App begins loading; App chrome loaded; App loaded