−200
−100
0
100
200
300
−30
−20
−10
0
10
20
plotly-logomark
Edit chart
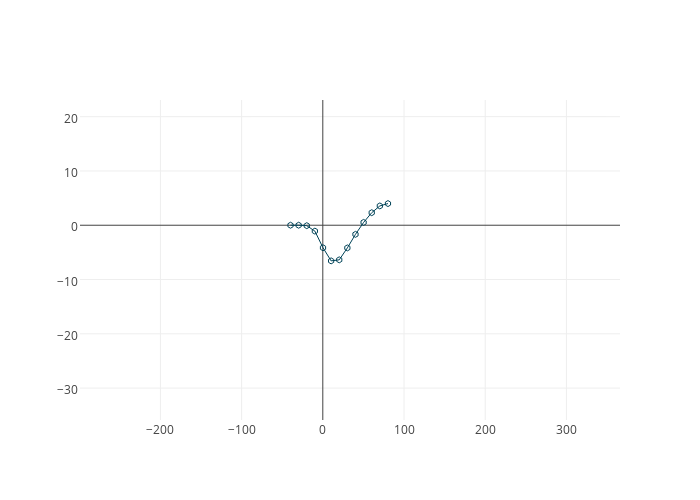
Vahidgh's interactive graph and data is a scatter chart. The x-axis shows values from -299.01677616616394 to 365.9749625022763. The y-axis shows values from -35.88071650128529 to 23.07281534795997.