0
1
2
3
4
5
0
5k
10k
15k
20k
I1
SI2
SI1
VS2
VS1
VVS2
VVS1
IF
carat
price
plotly-logomark
Edit chart
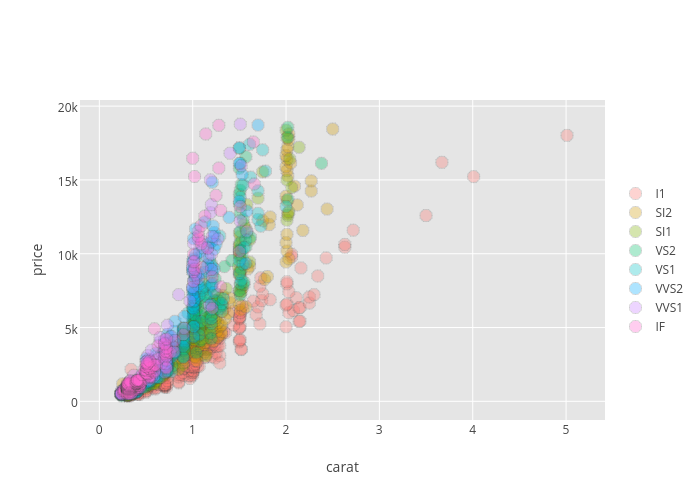
Rgraphingapi's interactive graph and data of "price vs carat" is a scatter chart, showing I1, SI2, SI1, VS2, VS1, VVS2, VVS1, IF; with carat in the x-axis and price in the y-axis.. The x-axis shows values from -0.13327178876315265 to 5.343271788763152. The y-axis shows values from -1162.8369239976062 to 20311.836923997605.