0
50
100
150
200
250
300
350
400
0
100
200
300
400
500
600
700
800
1
2
3
4
5
6
Fit of 1
Fit of 2
Fit of 3
Fit of 4
Fit of 5
Fit of 6
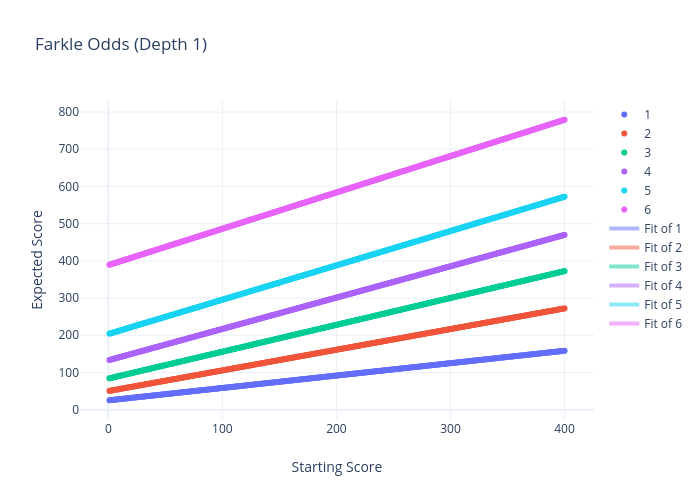
Farkle Odds (Depth 1)
Starting Score
Expected Score
plotly-logomark
Edit chart
Pwpon500's interactive graph and data of "Farkle Odds (Depth 1)" is a scatter chart, showing 1, 2, 3, 4, 5, 6; with Starting Score in the x-axis and Expected Score in the y-axis.. The x-axis shows values from -22.6799563080284 to 423.6799563080284. The y-axis shows values from -23.524023980828492 to 828.1333346804171.