5
10
15
20
0
5
10
15
Undercurrent Most Responsive
Undercurrent Most Responsive - fit
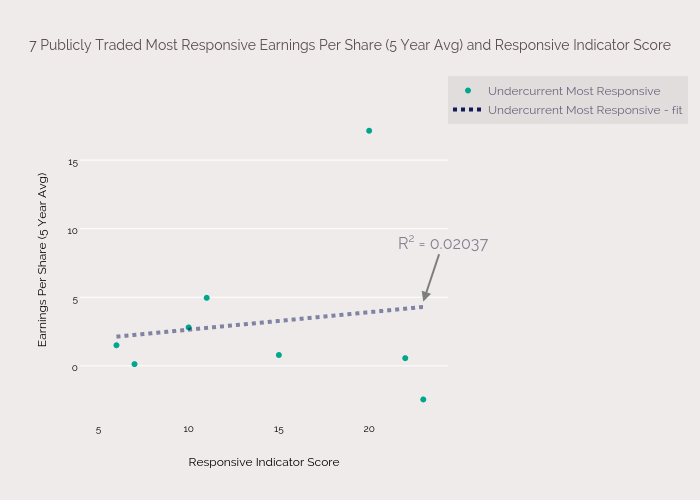
7 Publicly Traded Most Responsive Earnings Per Share (5 Year Avg) and Responsive Indicator Score
Responsive Indicator Score
Earnings Per Share (5 Year Avg)
R
2
= 0.02037
plotly-logomark
Edit chart
Pragerd's interactive graph and data of "7 Publicly Traded Most Responsive Earnings Per Share (5 Year Avg) and Responsive Indicator Score" is a scatter chart, showing Undercurrent Most Responsive vs Undercurrent Most Responsive - fit; with Responsive Indicator Score in the x-axis and Earnings Per Share (5 Year Avg) in the y-axis.. The x-axis shows values from 3.979481003818158 to 24.369021602487585. The y-axis shows values from -3.945229878303194 to 19.3782281618949. This visualization has the following annotation: R2 = 0.02037