85
90
95
100
105
110
115
0
5k
10k
15k
20k
25k
30k
Undercurrent Most Responsive
Undercurrent Most Responsive - fit
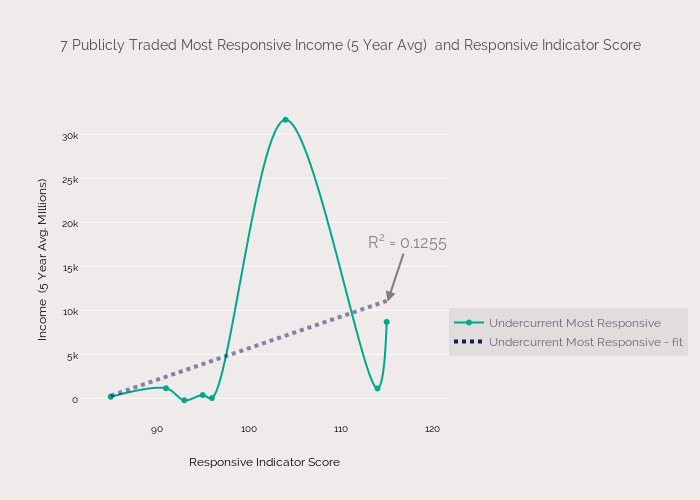
7 Publicly Traded Most Responsive Income (5 Year Avg) and Responsive Indicator Score
Responsive Indicator Score
Income (5 Year Avg. MIllions)
R
2
= 0.1255
plotly-logomark
Edit chart
Pragerd's interactive graph and data of "7 Publicly Traded Most Responsive Income (5 Year Avg) and Responsive Indicator Score" is a line chart, showing Undercurrent Most Responsive vs Undercurrent Most Responsive - fit; with Responsive Indicator Score in the x-axis and Income (5 Year Avg. MIllions) in the y-axis.. The x-axis shows values from 82.82732952723902 to 120.15478840136565. The y-axis shows values from -2282.9476489028216 to 33691.54764890282. This visualization has the following annotation: R2 = 0.1255