0
10
20
30
40
0
10
20
30
40
20
40
60
80
100
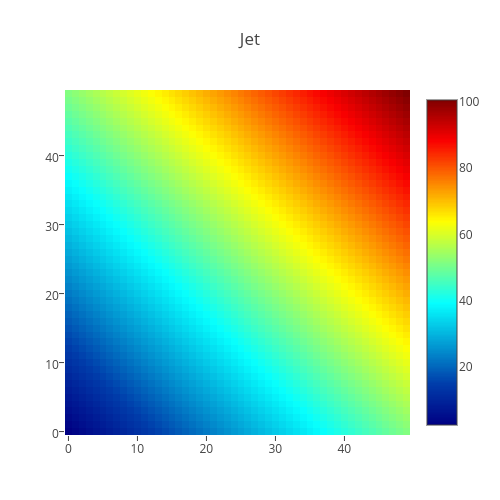
Jet
plotly-logomark
Edit chart
Plotbot's interactive graph and data of "Jet" is a heatmap. The x-axis shows values from 0 to 0. The y-axis shows values from 0 to 0.