1996
1998
2000
2002
2004
2006
2008
2010
2012
0
100
200
300
400
500
Rest of world
China
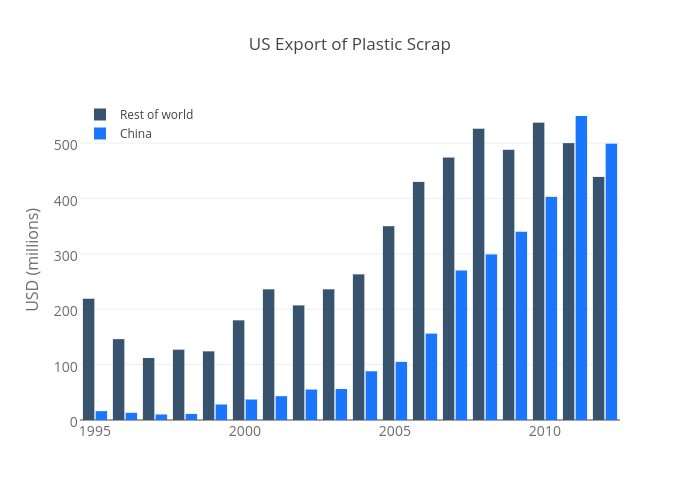
US Export of Plastic Scrap
USD (millions)
plotly-logomark
Edit chart
Plotbot's interactive graph and data of "US Export of Plastic Scrap" is a grouped bar chart, showing Rest of world vs China; with USD (millions) in the y-axis. The x-axis shows values from 0 to 0. The y-axis shows values from 0 to 0.