trace 0
trace 1
−3
−2
−1
0
1
2
3
trace 0
trace 1
plotly-logomark
Edit chart
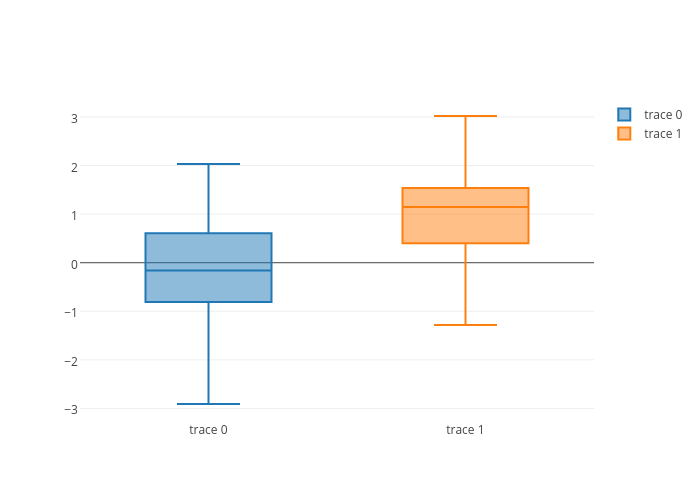
Plotbot's interactive graph and data is a box plot. The x-axis shows values from 0 to 0. The y-axis shows values from 0 to 0.