AWS::AppStream::ImageBuilder
AWS::AmazonMQ::Broker
AWS::Elasticsearch::Domain
AWS::RDS::DBInstance
AWS::WAF::IPSet
AWS::WAF::SizeConstraintSet
AWS::WAF::ByteMatchSet
AWS::WAF::XssMatchSet
AWS::WAF::SqlInjectionMatchSet
AWS::Redshift::Cluster
AWS::Transfer::Server
AWS::EC2::TransitGateway
AWS::WAFRegional::IPSet
AWS::WAFRegional::GeoMatchSet
AWS::WAFRegional::ByteMatchSet
AWS::WAFRegional::SqlInjectionMatchSet
AWS::Neptune::DBCluster
AWS::DocDB::DBCluster
AWS::RDS::DBCluster
AWS::Cloud9::EnvironmentEC2
AWS::Route53::HostedZone
AWS::IoT::Thing
AWS::IoT::Policy
AWS::KMS::Key
AWS::MediaStore::Container
AWS::ServiceDiscovery::HttpNamespace
AWS::ServiceDiscovery::PublicDnsNamespac
AWS::WAFRegional::SizeConstraintSet
AWS::IAM::Group
AWS::IAM::User
0
100
200
300
400
500
600
700
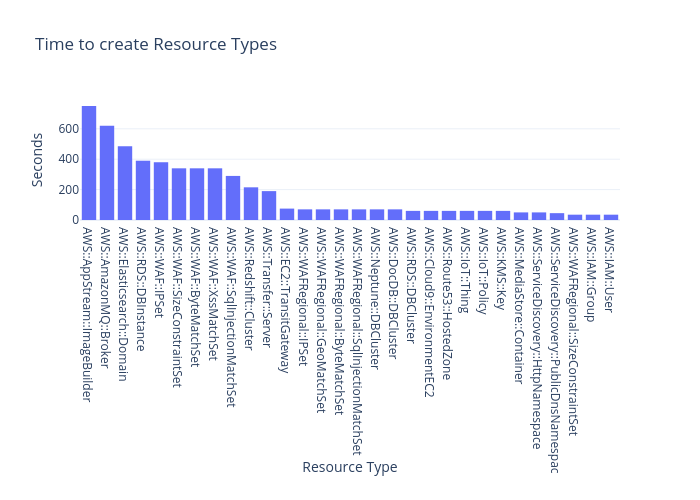
Time to create Resource Types
Resource Type
Seconds
plotly-logomark
Edit chart
Patmyron's interactive graph and data of "Time to create Resource Types" is a bar chart; with Resource Type in the x-axis and Seconds in the y-axis.. The x-axis shows values from -0.5 to 29.5. The y-axis shows values from 0 to 789.4736842105264.