Antonio (2019) Romans K10
plotly-logomark
Edit chart
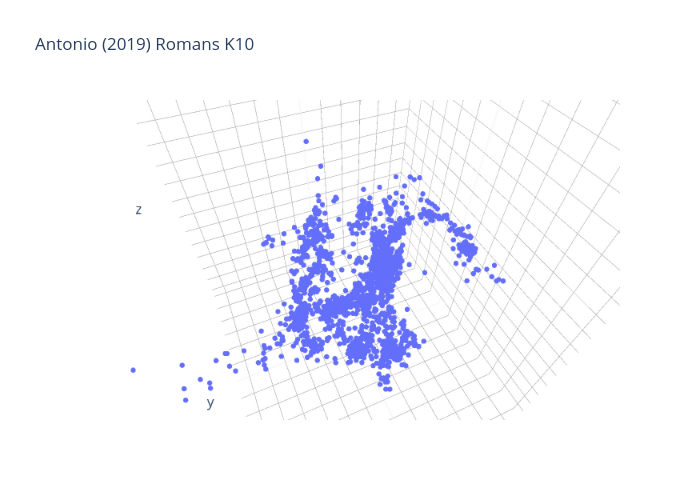
Open_genomes's interactive graph and data of "Antonio (2019) Romans K10" is a scatter3d. The x-axis shows values from -1 to 6. The y-axis shows values from -1 to 4.