0
2
4
6
8
10
12
−0.5
0
0.5
1
J_0(k)
J_1(k)
J_2(k)
J_3(k)
J_4(k)
J_5(k)
J_0(k) - fit
jkjkjkj;kj;kj;kj;lkj;lj;ljj;lkj;lkj
jj;kj'kj
plotly-logomark
Edit chart
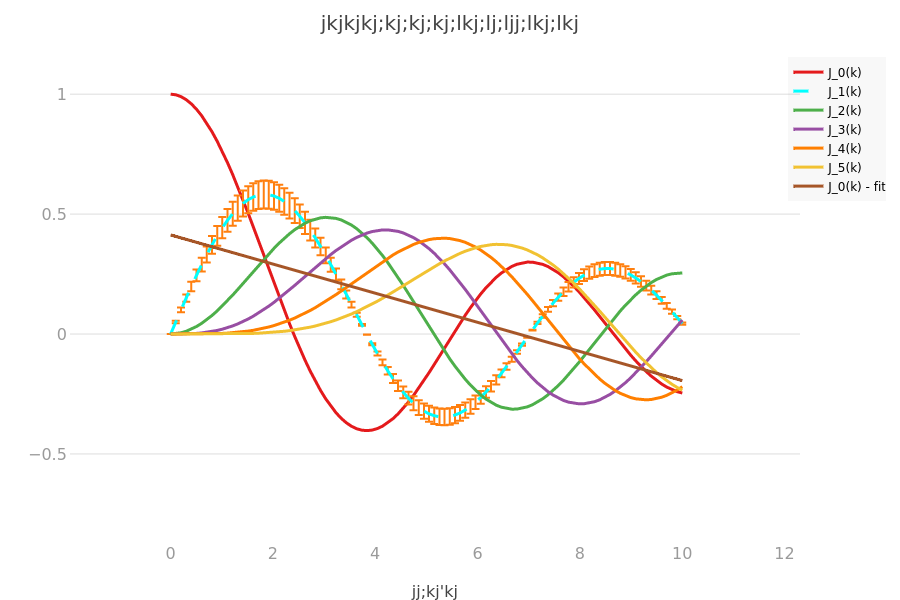
Maxlinke's interactive graph and data of "jkjkjkj;kj;kj;kj;lkj;lj;ljj;lkj;lkj" is a scatter chart, showing J_0(k), J_1(k), J_2(k), J_3(k), J_4(k), J_5(k), J_0(k) - fit; with jj;kj'kj in the x-axis. The x-axis shows values from -1.967036507588241 to 12.299912566719996. The y-axis shows values from -0.8588080292335292 to 1.142488852283178.