The 1000 Most Populous Canadian Cities
plotly-logomark
Edit chart
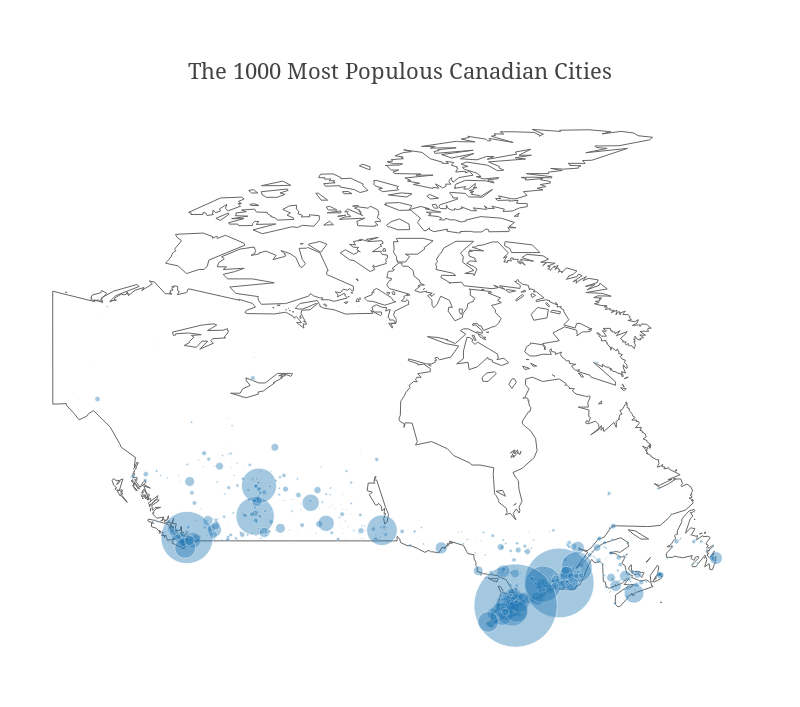
Mattsundquist's interactive graph and data of "The 1000 Most Populous Canadian Cities" is a scatter chart, showing State Border vs City; with in the x-axis and in the y-axis.. The x-axis shows values from -142.70287016029138 to -46.83449797029642. The y-axis shows values from 36.91531256780877 to 85.46129933853639.