Col1
Col2
1
1.5
2
2.5
3
3.5
4
4.5
Col1
Col2
Boxplot for Kabbo
plotly-logomark
Edit chart
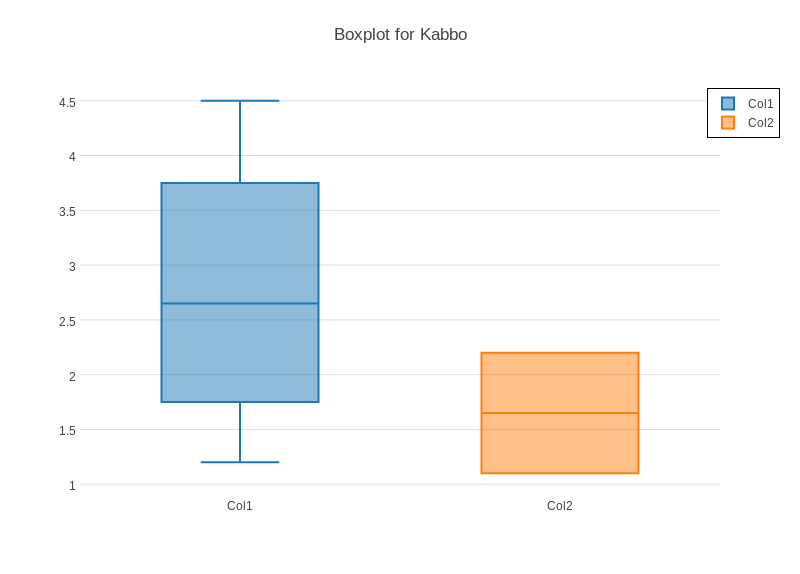
Mattsundquist's interactive graph and data of "Boxplot for Kabbo" is a box plot, showing Col1 vs Col2. The x-axis shows values from -0.5 to 1.5. The y-axis shows values from 0.9111111111111112 to 4.688888888888889.