−140
−130
−120
−110
−100
−90
−80
−70
−60
−50
40
45
50
55
60
65
70
75
80
long
lat
plotly-logomark
Edit chart
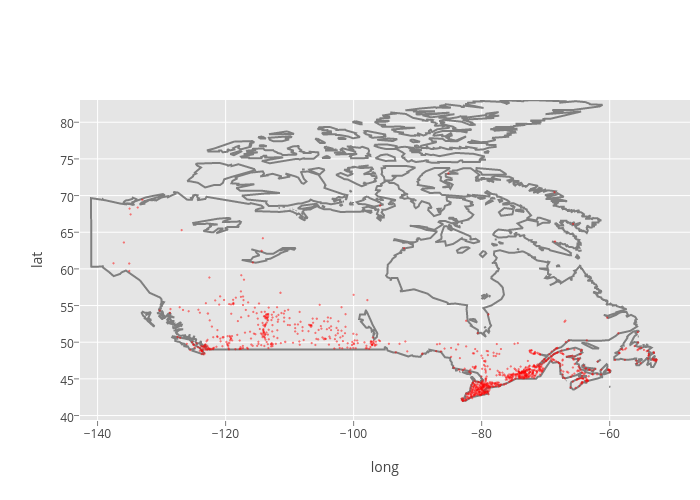
Mattsundquist's interactive graph and data of "lat vs long" is a filled line chart, showing borders vs cities; with long in the x-axis and lat in the y-axis.. The x-axis shows values from -142.70602327173168 to -47.49397672826831. The y-axis shows values from 39.463738441231904 to 83.0339050292969.