−4
−3
−2
−1
0
1
2
3
4
5
0
20
40
60
80
100
120
140
160
xvar
count
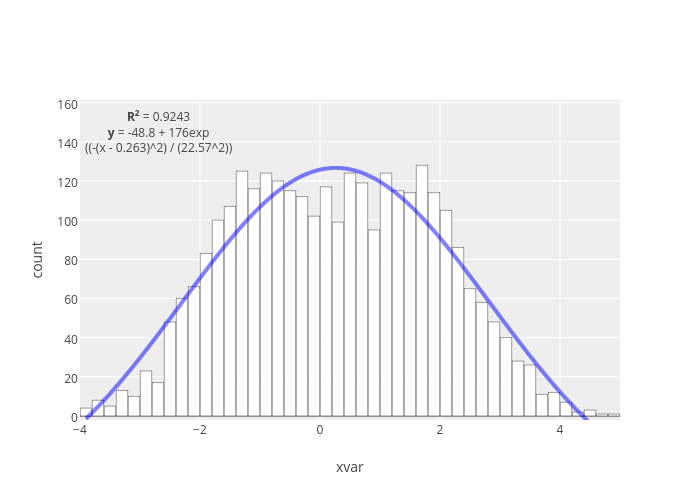
R
2
= 0.9243
y
= -48.8 + 176exp
((-(x - 0.263)^2) / (22.57^2))
plotly-logomark
Edit chart
Mattsundquist's interactive graph and data of "count vs xvar" is a histogram, showing Histogram vs best fit:R2 = 0.9243y = -48.8 + 176exp((-(x - 0.263)^2) / (22.57^2)); with xvar in the x-axis and count in the y-axis.. The x-axis shows values from -3.9999999999999996 to 5.0000000000000036. The y-axis shows values from -2.075302338391822 to 161.3360442471112. This visualization has the following annotation: R2 = 0.9243y = -48.8 + 176exp((-(x - 0.263)^2) / (22.57^2))