0.2
0.4
0.6
0.8
1
1.2
1.4
1.6
0
2k
4k
6k
8k
10k
12k
14k
16k
VVS1
IF
VVS1 - fit
IF - fit
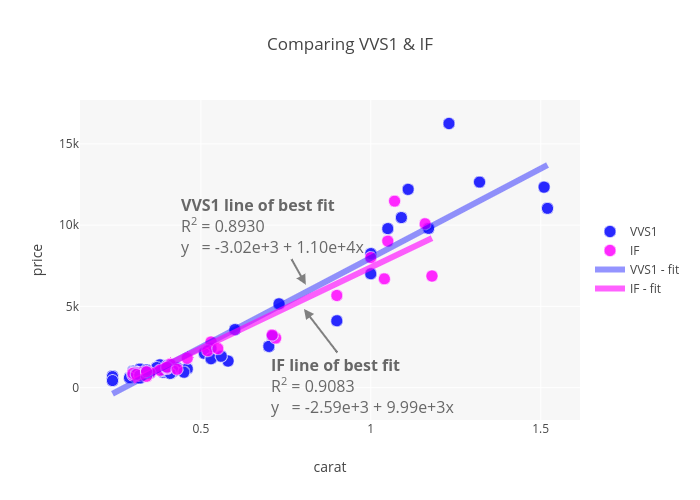
Comparing VVS1 & IF
carat
price
IF line of best fit
R
2
= 0.9083
y = -2.59e+3 + 9.99e+3x
VVS1 line of best fit
R
2
= 0.8930
y = -3.02e+3 + 1.10e+4x
plotly-logomark
Edit chart
Mattsundquist's interactive graph and data of "Comparing VVS1 & IF" is a scatter chart, showing VVS1, IF, VVS1 - fit, IF - fit; with carat in the x-axis and price in the y-axis.. The x-axis shows values from 0.15708090957165521 to 1.6029190904283448. The y-axis shows values from -1321.6439138855826 to 17512.11055132594. This visualization has the following annotations: IF line of best fitR2 = 0.9083y = -2.59e+3 + 9.99e+3x; VVS1 line of best fitR2 = 0.8930y = -3.02e+3 + 1.10e+4x