1960
1970
1980
1990
2000
2010
5
6
7
8
9
1e+3
2
3
4
5
6
7
8
9
1e+4
Chile
Hungary
Uruguay
year
NY.GNP.PCAP.CD
Source:
World Bank
plotly-logomark
Edit chart
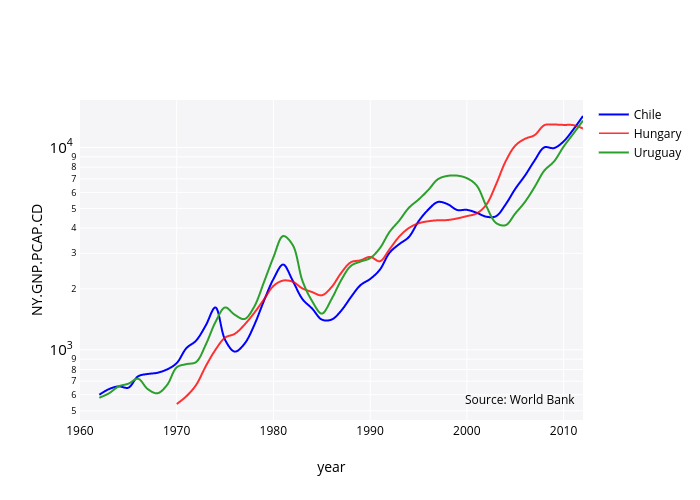
Mattsundquist's interactive graph and data of "NY.GNP.PCAP.CD vs year" is a line chart, showing Chile, Hungary, Uruguay; with year in the x-axis and NY.GNP.PCAP.CD in the y-axis.. The x-axis shows values from 1960 to 2012. The y-axis shows values from 2.6533245446042573 to 4.234708848978488. This visualization has the following annotation: Source: World Bank